Thursday, January 27, 2011
Initiated TBT and IEF bond pair
Re-enter the TBT and IEF bond pair with half of the portfolio size as the technical indicators for TBT showed sign of improvement. The RSI and Williams %R crossed above the mid point line which indicated there is a potential upward momentum for TBT. TBT is the 2X inverse of TLT.
Saturday, January 22, 2011
Expand Bond pair trading to ETF Pair Trading
On the Bond Pairs Trading Portfolio, I realized that I may miss out some other ETF potential trades if I just wait for the bond pairs signal. Therefore, I expand it to other ETF pairs in order to create more opportunity. ETF pairs that I am looking at are TNA, TZA, FAS, FAZ, SSO, SDS, SPY, SH and others. The portfolio will include 1x, 2x, and 3x leverage pairs and it is now named ETF Pair Trading. Let see how it plays out.
Thursday, January 20, 2011
Cash out on TBT and IEF pair
Closed the position on TBT and IEF pair with some profits. Will wait for the next entry signal.
Wednesday, January 19, 2011
Took profits with first sign of pulling back
S&P 500 may hit some resistance when it reaches to the 1300 level and can cause some short term pullback. I took profits on three portfolios except the bond pair. I will wait for the next signal to enter the new positions.


Monday, January 17, 2011
Continue to hold SSO
Major markets continued to be strong last week but we may be in the over bought territory and pull back is way over due. Should there be any sign of weakness, it may be time to lock in some profits. Until then, enjoy the ride.


Wednesday, January 12, 2011
Added SPY shares as momentum picked up
Added SPY shares on Ocean Portfolio and TSP Portfolio as momentum picked up again


Initiated the Bond Pair with TBT and IEF
The TBT and IEF pair looked pretty good as interest rate may go up in the future. The inverse 2X TBT can be benefited from it where the IEF just to hedge its position.


Monday, January 10, 2011
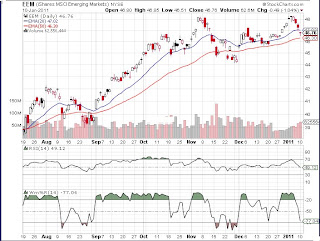
Sold ETF losers
Sold EEM, EWZ and VWO at the close today to cut the loss small.
Click here for:
Ocean Portfolio Performance
Click here for:
Ocean Portfolio Performance

Sunday, January 9, 2011
Took some profits off the Bond Pairs
Took profits from the ProShares UltraShort Lehman 20+ Year Treasury (TBT) and the iShare Barclays 7-10 Year Treasury Bond (IEF). I will wait for the next signal to get back in.
Click here for the Bond Pair performance spreadsheet:
Bond Pair Performance
IWM and EFA looked weak on the TSP portfolio, took small loss and liquidated it.
Click here for the TSP portfolio performance spreadsheet
TSP Portfolio Performance
Click here for the Bond Pair performance spreadsheet:
Bond Pair Performance
IWM and EFA looked weak on the TSP portfolio, took small loss and liquidated it.
Click here for the TSP portfolio performance spreadsheet
TSP Portfolio Performance
Saturday, January 1, 2011
Happy New Year and Happy Trading in 2011
I started two portfolios in this blog with one focuses on a 2 times leverage of SSO and SDS and the other focuses on the bond pairs trading. These ETF bonds are TLT vs PST (2x inverse) and TBT (2x inverse) vs IEF. The reason that I choose reverse is that it can be traded in a retirement account where short trade is prohibited in this type of accounts.
The pairs trading will be traded with a long and short pair in the interest rate ETF bonds. I only chose the TLT (iShares Barclays 20 year treasury) vs PST (ProShares Ultra Short Lehman 7 - 10 year bond) and the TBT (ProShares Ultra Short Lehman 20 Year treasury) vs IEF (iShares Lehman 7 - 10 year treasury). The reason I chose the inverse ETF instead of short is that it can be traded in a non-margin retirement account and not paying dividend on the shorts. The pair will be traded in a non-correlated fashion comparing with the equity markets but the pair itself is highly correlated. This is to be less risky because of the nature of the correlated long and short pair in theory will go from convergence to divergence, and to convergence again from time to time as it is referred to "reverse-to-mean". The profits will be made when the pair reverses to its normal spread. For detail information on pair trading, reader can google pair trading and there are tremendous info related to pair trading or pairs trading on the internet.
As of 12/31/2010, all portfolios are fully invested based on my observation that the overall market will continue to trend up in a near term. The NYSE Advance and Decline issues indicated that this is the case at the moment. See chart below, as long as the $NYAD index stays above the 20 and 50 EMAs, the portfolios will remain the current positions.
Below is the chart on NYSE Advance and Decline Issues which indicated that the upward momentum is still strong.

Subscribe to:
Posts (Atom)